Monday, November 26, 2012

Dashboard Imaging — see beneath your Dashboard's skin.

When building Tableau dashboards it's helpful to know what's already in them – placing and organizing components is affected by the components already in there.

Where you can place things, and how they behave when you do is particularly sensitive to the presence of layout containers. And there are multiple types of layout containers—horizontal and vertical containers are available in the dashboard window so you can place them into the dashboard, although their behaviors aren't well, if at all, documented. For example, a vertical container pushes it's contained components into the minimal space at the top, which is handy as it's the only way one can top-align text, the regular dashboard text component lacking that ability.

There are at least two other containers that Tableau puts into dashboards as you add and manipulate components. Tableau uses these for its own purposes, and even though they affect the dashboard's layout and behavior, Tableau doesn't let you know that they're there, although in some cases (I haven't quite puzzled this through) they can be seen via a component's "Select Layout Container" right-click option.

It would be nice to see what component panels are in a dashboard.

For example, this Tableau Public-published workbook contains "Dashboard 8", which has a variety of components.

Dashboard 8 is nothing special, there appear to be a dozen or so visible components in it, but how to tell for sure, and how do we tell what (layout containers are in it, abd what their types are?

Imaging Dashboard 8

Dashboard 8 has 20 components.

The image above shows Dashboard 8's components laid out so as to show them in context, with their essential characteristics including type, dimension, and placement visible. The diagonal lines span the horizontal and vertical containers, forward-leaning for horizontal, backward-leaning for vertical. The image shows a single HTML page with the schematic on the left, and Dashboard 8's components in the table on the right, one component per row.

The static image is nice, but there's more.

When one mouses over a table row the corresponding component is highlighted in the schematic. The video below shows this in action. (The screen capture didn't grab the mouse.)

How'd your get that schematic/HTML page?

I'm glad I asked. The HTML page is generated by my latest Ruby tool. When run it locates all of the TWBs in the local directory, and in all sub-directories, and creates a separate HTML page for every dashboard in every workbook. Running on my local machine it takes a minute or so to find and create the HTML for 1308 Dashboards in 662 Workbooks.

Live Action Highlighting

Sunday, November 11, 2012

Finally - you can use the Tableau data colors in your formatting.

Yes, it's true. You can now harmonize your color schemes by using the Tableau data colors in your formatting.

The short version — use the Worksheet below to find the RGB values for the Data Color Palette colors you need and then use those values in the Format coloring of the objects you need colored.
One of Tableau's great strengths is its exceptional proficiency at coloring the various visualization elements. The defaults it chooses have been carefully crafted to work very well under a wide variety of circumstances, and Tableau provides a good set of mechanisms for configuring the colors where needed..
But...
It's really frustrating that Tableau uses two different mechanisms for configuring colors, and the colors aren't consistent across them.

Coloring data.

The colors contained in the data-coloring Palettes are both excellent choices for visualization and fixed sets that can't readily, if at all, be extended or otherwise changed.

Format coloring.

Tableau's formatting systems actually provide two different palettes, but share a common mechanism for specifying the RGB values that specify the full set of available colors.
So...
It's possible to make the formatting colors match the data Palette colors via the RGB specification mechanism
if only.. the RGB values of the data Palette colors were known. But Tableau doesn't reveal them. At least not through its User Interface.

The Tableau Data Color RGB Values

The Tableau Public-published Workbook embedded below provides the RGB values for every color in every Tableau data palette so you can use them in configuring the colors in your Worksheets and Dashboards. Everything that can be color-formatted can now use the same colors as Tableau makes available for data coloring.

But wait, there's more

There's quite a lot more to the Tableau color story, e.g.
  • Many of the data colors are used in multiple palettes.
  • Many of the colors are visually nearly indistinguishable from one another.
  • Colors are configured to elements at the data source ‐ explaining why changing the colors in one worksheet changes the colors in others. This is very similar to other scoping situations where Tableau doesn't really notify one that local actions have non-local side effects.
  • When the Automatic Palette is in effect, no specific values are used or recorded.
  • The Automatic Palette uses the same colors as the Tableau 10 Palette.
  • It's not visible, but once Tableau is configured to color field elements it remembers those colorings even when the field is no longer in the data source. This could lead to serious downstream problems.

Look through the Dashboards and Worksheets to see more.


Thursday, November 8, 2012

Dashboard Images Revealed

Some interesting dashboard image facts:

You can embed images in your dashboards. OK, that's not news. Things you may not realize:

  • You can embed images in your dashboards. OK, that's not news.
  • You can specify a PDF as the image file, but Tableau won't produce an image.
    (you can embed the PDF in a Web Page component)
  • Once you've inserted the image Tableau doesn't show you the image's source, so there's now way to tell what file is being shown.
  • Tableau doesn't forget the images you've put in the Image component—if you add a second image, Tableau remembers the name of the first; add a third, the second is remembered, etc.
    So be careful about using placeholder images, their ghosts will be lurking about.

Revealing your Dashboards' Images

The Ruby script below will scan the current and all descendant directories for TWBs and for each one found will identify the images and report on them with the Workbook, Dashboard, and Image details. The information is captured as data in the CSV file "TCC_DI.csv", which you can analyze with Tableau.


# TCC_DI.rb - this Ruby script Copyright 2012, Christopher Gerrard # - show the images in the Workbooks' Dashboards require 'nokogiri' require 'open-uri' $twbCnt, $twbNum, $recNum = 0, 0, 0 def init $f = File.open("TCC_DI.csv",'w') $f.puts 'Record #,Workbook,Workbook Dir,Dashboard,Image,Image Dir' unless $f.nil? print "\n\tScanning for Dashboard images\n\t" end def showImages twb doc = Nokogiri::XML(open(twb)) $twbCnt += 1 dashes = doc.xpath('//workbook/dashboards/dashboard' ) if dashes.length > 0 then $twbNum += 1 twbName = File.basename(twb) twbDir = File.dirname(twb) end dashes.each do |d| dName = d.xpath('./@name').text images = d.xpath('//zone[@type="bitmap"]') images.each do |i| iName = i.xpath('./@param').text print '.' imgName = File.basename(iName) imgDir = File.dirname(iName) $f.puts "\"#{$recNum+=1}\",\"#{twbName}\",\"#{twbDir}\",\"#{dName.gsub('"','""')}\",\"#{imgName}\",\"#{imgDir}\"" if $recNum.modulo(72) == 0 then print "\n\t" end end end end init Dir.glob("**/*.twb") {|twb| showImages twb } $f.close unless $f.nil? plural = if $twbNum == 1 then '' else 's' end puts "\n\tDone.\n\tFound #{$recNum} images in #{$twbNum} Workbook#{plural} of #{$twbCnt} Workbooks scanned" if $recNum > 0 then puts "\tTCC_DI.csv contains the image names & the Dashboards containing them." end


No Workbooks are harmed during the revealing of the Images.

Your workbooks are unaffected, nothing is done to them.

How to use TCC_DI.rb

  • Prerequisites
    • Minimal technical skills.
    • Have Ruby installed and ready to run.
    • Have the Nokogiri Ruby gem installed—it's used in the XML parsing.
    • Have TCC_DI.rb in place—it doesn't matter where, or what name you use, as long as you know where it is.
      You can copy the code above and paste it into your favourite text editor.
  • Running TCC_DI.rb
    • Open a command prompt.
      (you can run it otherwise, but this is simple and straightforward)
    • CD to the directory containing the Workbooks you're interested in.
    • Run it: "[path to]\ruby    [path to]\TCC_DI.rb"
    • Note, TCC_DI.rb also looks through all the directories below the current one.
  • Presto. You now have a TCC_DI.csv file containing the information about your Dashboard images, if any.

The usual caveats.

TCC_DI.rb works fine with the limited testing it's been through, but it's definitely not bulletproof and hardened. It's only been run against Tableau v7 Workbooks, and it's entirely possible that images in other Tableau version Workbooks, or images coded in the TWBs in a manner other than the one in my sample TWBs not found might not be detected.

I hope it works for you, but make no guarantees. If you do use it and make improvements I hope that you'll post them back here as comments so I can learn from them, and hopefully other people can benefit from them too.

Tuesday, November 6, 2012

Fallacious Overspecificity

This is a happy day. I'm writing about a situation where Tableau is the solution to a particularly pernicious problem. The lubricant, if you will allow me, that frees the stuck gears of informed discourse by elimination a particular point of friction.

I attended a session today at the annual Tableau Customer Conference, TCC 2012—Stat Spotting: A Field Guide to Identifying Dubious Data, by Dr. Joel Best, Professor, University of Delaware.

Dr. Best covered a number of ways in which numbers are misused, often to great effect, in support of a wide variety of claims across the culture. Many of them are only too familiar to those of us who were raised numerate, and it was a great comfort that these abuses of numeracy are a formal topic of rigorous study.

I chose to work in my profession because I believe that facts and data are important aids that people can take advantage of and employ to make better informed decisions. With more than 25 years in BI one recurring theme I've seen is one Dr. Best identified, which goes something like this:

New! Improved! 106.7% cleaner in independent blind evaluations!

703% ROI in just 11 months.

16.7 people are injured every month in their slippers.

Raise your child's IQ by 14.8% in only 16 short weeks!

We can implement your Enterprise BI solution in 23.4 weeks, starting when we begin the discovery phase.

All of the above employ the all too common tactic of using precise values as a persuasive tool. All of them are also lying, using values with a degree of precision that's either impossible to exist, impossible to measure within the standard conventions of arithmetic precision, or simply monkeys-out-the-butt fabrication.

They're all examples of fallacious overspecificity—the use of a numerically precise value for a deceptive purpose without regard for whether the value is or could be real or true.

One of the great advantages of using Tableau is that it dramatically reduces the effort to "check the numbers" and see what, if any, data evidence supports claims that smell of fallacious overspecificity.

Tableau's great virtue is that is makes it simple to explore and examine data. This directly challenges fallacious overspecifiers because of the ease with which the facts and number behind the numbers can be examined to validate or refute the truth of the claim. This benefit is cumulative, as data analysis becomes the norm numeracy increases and eventually the penalties for misreporting or misrepresenting numeric values tilt the cost-benefit assessment strongly in favor of truth and accuracy.

Monday, November 5, 2012

Unhide that Worksheet!

Or – Worksheet? What Worksheet? I don't see no stinking Worksheets.

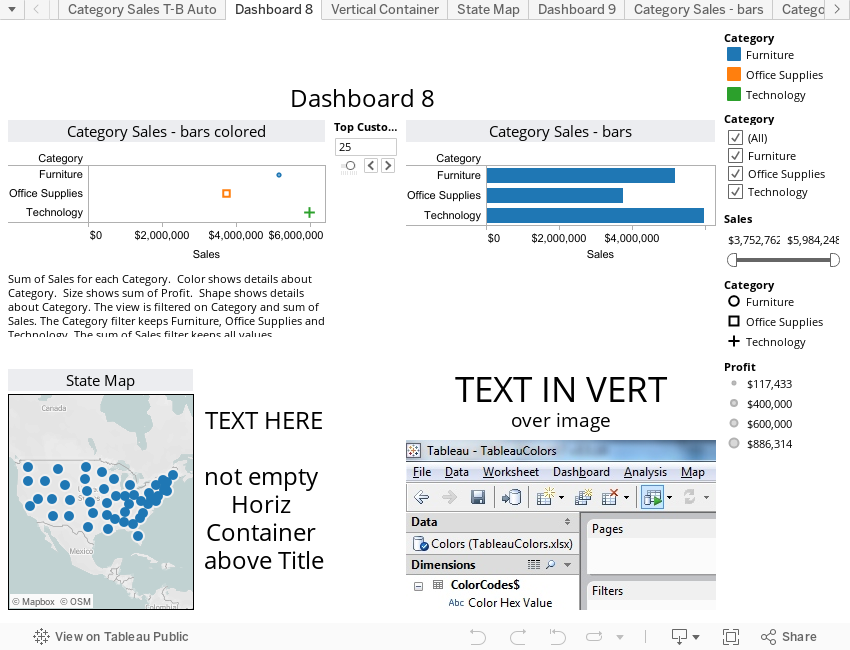
Hidden Worksheets are one of Tableau's enduring mysteries. Once hidden, a Worksheet's only visible presence in Tableau is as a component of the Dashboard(s) in which it appears.

Their stealthy nature makes them difficult to work with. But there are ways to find them:

  • the simplest is to look through the Dashboards until they're spotted but this is tedious at best and since well-designed Dashboards tend to camouflage their individual Worksheets it's also very error-prone.
  • You can use an automated Workbook analysis approach, e.g.
    • The Tableau Companion (aka TWIS) is a full featured Workbook analysis and inventorying system. Its unique feature is the creation of diagrams—PDFs, GIFs, and SVGs, showing the Dashboards and Worksheets in your Workbooks:
      If TCC is a bit much, you could use...
    • Andy Cotgreave's TWB Auditor is a very nice, polished, easy to use way to get the information, or
    • This post presents a short (37 line) Ruby script that will pull the Workbook-Dashboard-Worksheet information from your Workbooks so that you can see what's where. And the code is right there so you can be sure of what it's doing, or even improve it if you want.

So that's where the Worksheets are. Now what?

Knowing where the Worksheets are is very nice, but it only addresses part of the problem. The hidden Worksheets are still hidden, and unhiding them means opening up their Workbooks with Tableau Desktop, and for each hidden Worksheet navigating to a Dashboard containing the hidden Worksheet, "Going to" the Workbook, and right-click 'unhiding' it.

Unless...

You download or copy/paste and run the following Ruby script in the directory containing the Workbooks you want the Worksheets unhid in. ('Unhid'–is that a real word?)


# TCC_sW.rb - this Ruby script Copyright 2012, Christopher Gerrard require 'nokogiri' require 'open-uri' $hwTwbs = 0 $recNum = 0 def init $f = File.open("TCC_HWs.csv",'w') $f.puts 'Record #,Workbook,Worksheet,class,auto-hidden,maximized' unless $f.nil? puts "\nHidden Windows found for Workbooks:\n-----------------------------------" end def showWindows twb doc = Nokogiri::XML(open(twb)) h1 = handleHiddenNodes(twb, doc, '//workbook/windows/window[@class="hidden-worksheet"]' ) h2 = handleHiddenNodes(twb, doc, '//workbook/windows/window[@auto-hidden="1"]' ) if h1 || h2 writeTWB(doc, twb) end end def handleHiddenNodes(twb, doc, xPathStr) nodes = doc.xpath(xPathStr) if nodes.length > 0 then unhideWindows(nodes, twb) hidden = true else hidden = false end end def unhideWindows(wNodes, twb) puts twb wNodes.each do |n| puts n wName = n.xpath('./@name') wClass = n.xpath('./@class') autoH = n.xpath('./@auto-hidden') max = n.xpath('./@maximized') $f.puts "#{$recNum += 1},#{twb},#{wName},#{wClass},#{autoH},#{max}" unless $f.nil? n.set_attribute('class','worksheet') n.set_attribute('auto-hidden','0') n.set_attribute('maximized','0') end end def writeTWB(doc, twb) newTwb = File.open("#{twb.sub(/.twb$/,'')}.unhidden.twb",'w') newTwb.puts(doc) newTwb.close end init Dir.glob("*.twb") {|twb| showWindows twb } $f.close unless $f.nil?

What TCC_sW.rb does.

Each of the Workbooks in the current directory is opened up and examined for the presence of hidden Worksheets. If any are found they are unhidden and a copy of the Workbook is made with the unhidden Worksheets.

No Workbooks are harmed during the unhiding of the Worksheets.

The name of the new copy Workbook is the same as the name of the original Workbook with the trailing ".twb" replaced with ".unhidden.twb"

For example, the Workbook "FinancialAnalyses.twb" is copied, Worksheets unhidden, to ""FinancialAnalyses.unhidden.twb""

How to use TCC_sW.rb

  • Prerequisites
    • Minimal technical skills.
    • Have Ruby installed and ready to run.
    • Have the Nokogiri Ruby gem installed—it's used in the XML parsing.
    • Have TCC_sW.rb in place—it doesn't matter where, or what name you use, as long as you know where it is.
      You can copy the code above and paste it into your favourite text editor.
  • Running TCC_sW.rb
    • Open a command prompt.
      (you can run it otherwise, but this is simple and straightforward)
    • CD to the directory containing the Workbooks you're interested in.
    • Run it: "[path to]\ruby    [path to]\TCC_sW.rb"
  • Presto. You now have a set of your Workbooks with all of their Worksheets unhidden.

The usual caveats.

TCC_sW.rb works fine with the limited testing it's been through, but it's definitely not bulletproof and hardened. It's only been run against Tableau v7 Workbooks, and it's entirely possible that hidden Worksheets in other Tableau version Workbooks, or other types of Worksheet-hiding conditions might not be detected.

I hope it works for you, but make no guarantees. If you do use it and make improvements I hope that you'll post them back here as comments so I can learn from them, and hopefully other people can benefit from them too.

Friday, November 2, 2012

So, was that extract refreshed or not?

The need: have a Tableau Server-published data extract refreshed

Here's what the Tableau Server documentation says about using tabcmd for the job:


refreshextracts workbook-name or datasource-name

Performs a full or incremental refresh of extracts belonging to the specified workbook or data source. This command takes the name of the workbook or data source as it appears on the server, not the file name when it was published.
Examples
tabcmd refreshextracts --datasource sales_ds
tabcmd refreshextracts --workbook "My Workbook"
tabcmd refreshextracts --url SalesAnalysis
Option (short)Option (long)ArgumentDescription
 --incremental Runs the incremental refresh operation.
 --synchronous Runs the full refresh operation immediately in the foreground.
 --workbookName of a workbookThe name of the workbook containing extracts to refresh. If the workbook has spaces in its name, enclose it in quotes.
 --datasourceName of a data sourceThe name of the data source containing extracts to refresh.
 --projectName of a projectUse with --workbook or --datasource to identify a workbook or data source in a project other than Default. If not specified, the Default project is assumed.
 --urlURL name of a workbookThe name of the workbook as it appears in the URL. A workbook published as “Sales Analysis” has a URL name of “SalesAnalysis”.


The documentation seems to say that executing tabcmd with the proper options will cause the extract to be refreshed.

So I gave it a go, and here's the result:

C:\Program Files (x86)\Tableau\Tableau Server\7.0\bin>tabcmd refreshextracts --url "DashboardWithTDE" ===== Continuing previous session ===== Server: http://[TableauServer]/ ===== Username: adminName ===== Scheduling extracts for workbook 'DashboardWithTDE' to be refreshed now... ===== Succeeded ===== Workbook DashboardWithTDE' scheduled to have its extracts refreshed.

As it turns out, there was no visible evidence that the extract did get refreshed, including checking Tableau Server's maintenance section and looking at the published Dashboard.

So I had to download the Workbook, manually refresh the extract, and then republish the Workbook in order to make sure the published Dashboard contained up to date information. Which is what I was hoping to avoid doing all along.