Sometimes Tableau throws a curve ball. This is one of those times.
Suppose you had the opportunity to decide how transparent something was.
What would 100% transparency mean to you?
If you're like most people, 100% transparent means that it's completely clear, effectively invisible.
How about 0% transparent?
I'm betting that you'd think it was completely opaque, utterly blocking from view whatever's behind it.
50% transparent?
I think you're onto my point—50% transparent means that half the light gets through, so you can see, albeit a little dimly, what it's in front of.
Tableau lets you configure the Transparency of your vizzes' Marks.
Or does it?
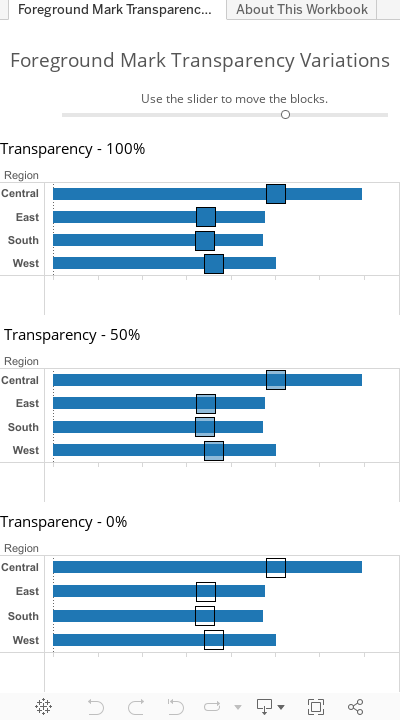
The Tableau Public published dashboard below shows three copies of the same Worksheet, configured with 100%, 50%, and 0% Transparency of the square marks. The only thing is, the % being configured is the Marks's Opacity.
Here are the Transparency configurations as set for the three vizzes' square marks - actual screen grabs from the Tableau Workbook.
As we can see plainly here, Transparency doesn't mean to Tableau what it means to me. (I think I'm not alone in this, but...)
Or maybe it's just that the Transparency control is just a little miswired.
Maybe it just needs a little adjusting.
I thought about flipping the control's scaling so that it would run 100%–0% left-right, as shown to the right.
This would work technically, but we expect numeric scales to increase left-right, so this is a no-go.
Changing the existing label on the control to "Opacity" would do the trick, with no functional changes.
But people are used to "Transparency", in Tableau and in most other visualy applications, so this isn't optimal.
What to do? What to do?
And then it occurred to me: stop overthinking things.
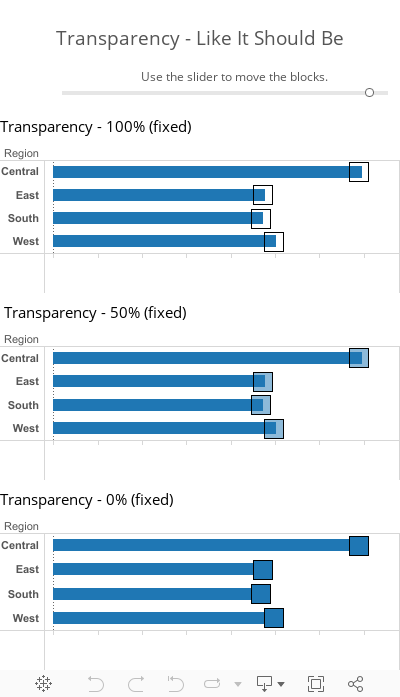
There's a solution that requires no changes to the user interface -and- corrects the situation so that 0% Transparency meams opaque, 100% Transparency means invisible, and all the intermediate values work correspondingly.
To wit:(drum roll, please)
Reverse the function that applies the Transparency value to the marks' transparency property.
This internal programmatic fix would restore the proper operation and balance to Transparency, allowing us to construct dashboards like the one to the right:
While we're at it...
It would be really handy if Transparency could be data-driven. The value can come from a field, source or calculated, or from a parameter, normalized to 0-100%.
Finally, you can put your labels where you want them.
In this post I'll show how to adapt the mechanism in this previous Hack Anatomy post—Hack Anatomy: Right-Aligning Bar Chart Labels—to provide complete flexibility in positioning a bar chart's labels, and in getting the presentation you want.
If this explanation seems a bit complicated, don't worry—it is.
It's also typical of the way one goes about getting Tableau to do things that aren't in its up-front abilities.
Positioning your labels.
Positioning and presenting your labels your way, as described here, relies upon two basic principles:
Using a secondary axis field to position the labels.
This field can be as simple or as complex as you need, sometimes a constant value works.
Sometimes you'll need to accommodate any possible inputs and so use Tableau Calculations to calculate it, this is the approach described here.
Synchronizing the chart's axes and, if necessary, using a fixed range for them.
Leaving the axes set to 'Automatic' is the most flexible, and guarantees that your labels will always be visible (Tableau makes room for them).
However, Tableau's alignment often get a little wobbly when left to juggle labels in the space it automatically provides for them, so setting the axes to a fixed range often results in better labels presentation.
It's unfortunate that Tableau doesn't permit more flexibility in automatic axis sizing—this would be very helpful.
Shown below are the results of applying a modification of Jonathan Drummey's use of the WINDOW_MAX() table calculation to generate a data value used on a secondary axis (hidden here) to provide a partner mark (also hidden here) for each bar whose label (shown here) is the bar's value.
First Step: adding controllable label positioning.
These examples are based on Jonathan's insight to use a second axis to position the bars' labels. The full description of the extensions are below.
In this example a padding amount is added to WINDOW_MAX(). The padding is user-configurable via a parameter.
Left-positioned labels.
This example places the labels to the left of the bars by using a negative value for the secondary axis measure.
The label positioning mechanism has been extended with a parameter that permits the user to select whether the labels are to be left- or right-positioned.
These examples put the labels in the right position—Tableau's intrinsic label positioning mechanisms adjust the chart's axes to accommodate the labels within the chart's body, but their presentation is rough. Tableau doesn't fully address all of the visual properties involved in label presentation. For example:
in the Right-Positioned example the labels are right-aligned with each other; this is a happy outcome that just happens to work out the way we want it;
in the Left-Positioned example the individual labels aren't vertically aligned in any apparently consistent manner.
A future post will cover the properties of label placement and alignment, and suggest ways in which Tableau can support them. This turns out to be a subtle and complex topic, with deeper consequences than are at first apparent.
Next Step: fine tuning the labels' presentation.
The examples below adjust the previous charts. The major difference is that the chart's axes are now fixed to values that optimize the labels' presentation. This is less flexible but aesthetically more pleasing than when the axes are dynamic and responsive to the bars' values.
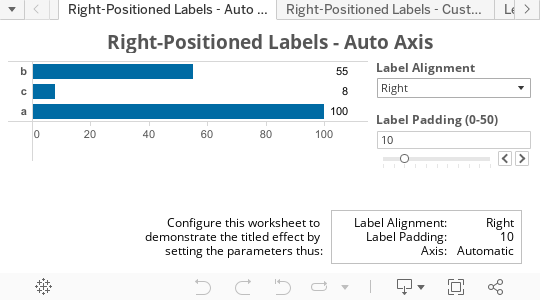
Right-positioned labels.
The labels are positioned, and the axis values are set, to provide an optimal amount of space between the bars, the labels, and the chart's right border.
Left-positioned labels.
See the note above.
In this example the labels are tidly placed to the left of the bars, aligned vertically, with enough space on either side for clarity in reading them but no so much that it visually disconnects the bars from their dimension member, e.g. 'a', 'b', or 'c'..
Label positioning in action.
The demo workbook.
This Tableau Public-published workbook shows this approach to label presentation live and in real time.
It contains four dashboards, each containing one of the four worksheets shown above. Instructions are in the dashboards for configuring "Label Alignment" and "Label Padding (0-50)" to create the alignment named in the dashboard's title.
You can use it to try out different combinations of Left/Right orientation and padding values to see how they work.
It's also a good idea to download it and look into it. There are things in Tableau that affect the label presentation that aren't amenable to automation, and that aren't' accessible except through the Tableau Desktop UI (and maybe via web editing, but I haven't checked that yet).
The examples above show labels that meet our aesthetic expectations. You should be able to obtain quality results for your own labeling.
It might take some experimenting to find a combination the value of the data field used on the second axis, and the specific configuration of the axes that nudges Tableau into putting the labels just so.
I built the parameters-based workbook to provide the dynamic flexibility to try out various positioning combinations. There's no way I know of to parameterize axis behavior, and I don't think one exists. My suggestion is that you take this model and experiment with your own labels. Once you find a good configuration you may not need to use a Table Calculation for your secondary axis field, but can use a simple constant. This would be simpler, easier to understand later on, even if you comment your field calculations diligently, and less computationally expensive.
Caveats.
Yes, there are caveats.
Although it's possible to get good results, as shown above, label presentation is subject to elements I haven't covered that Tableau takes into account when determining exactly how to present the labels.
Since this is really a Hack Anatomy series post I'm deferring the full and detailed description of Tableau's label presentation mechanisms, all of the Tableau bits that affect the label presentation. It gets fairly twisty pretty quickly and needs attention as a separate topic.
Still, it wouldn't be nice to drop you cold like that, so here are the highlights, the major things that Tableau considers in presenting labels:
The mark's position.
This post covers this fairly well, I think.
The mark's label configuration, implicitly or explicitly via the Marks card.
Label alignment is the dominant property, but 'alignment' might not mean what you think it means.
The mark's size.
Big, fat marks take up space that their labels may not be allowed to impinge upon.
The mark's axis—Tableau expands axes to accomodate labels when necessary, but its algorithm for doing so ends up providing irregular results.
That's all, folks. I hope you found this informative and useful.
When editing Sheet names, the Ctrl+Left and Ctrl+Right key sequences don't work as expected.
Instead of moving the cursor to the beginning of the previous—Ctrl+Left, or next—Ctrl+Right, word in the Sheet's name, Tableau narrows or widens the viz's cells.
What I expect.
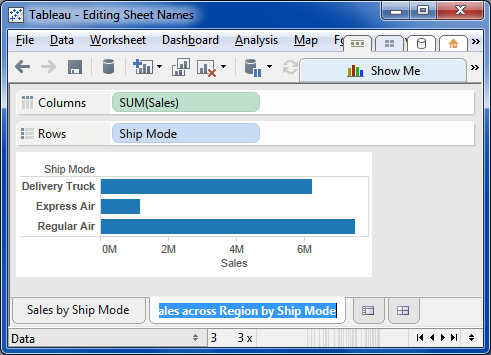
In this image I'm trying to edit the Worksheet's name.
I've just double-clicked on the name tab and Tableau's shifted into sheet name editing mode (my term).
At this point I'd like to be able to Ctrl+Left a number times so I can put the cursor at the start of "across".
This is how it works in v8.0, and every earlier version of Tableau I can remember.
What Tableau does.
As this image, captured immediately after typing Ctrl+Left, shows, Tableau narrows the cells instead of moving the cursor in the editable Sheet name.
This cell adjusting behavior is perfectly fine and good, in its place, but shouldn't happen when one's editing a Sheet name. Or when editing any text. Or even in any other context where Ctrl+[Left|Right] has different semantics.
Why this matters.
I duplicate Sheets a lot. When I found this I was creating a dozen clones of a seed Worksheet that I'm preparing for my mapping of Tableau's Table Calculations.
Since these clones are variations on one another, each presenting the same Table Calc fields, varying only in their "Compute using" configuring, I name them accordingly. This means there's a lot of editing the middle words in the Sheet's names.
With Tableau 8.1 mis-interpreting the while-editing Ctrl+[Left|Right] functional semantics, this process is much more laborious than it should be.
Even worse, because my editing muscle memory is wired to use Ctrl+[Left|Right] to jump to the previous/next word start, I've been consistently changing the cell sizes, only to have to reset them to their original dimensions in addition to edit the Sheets' names by crawling the cursor through them character by character.
(too wordy? too much noise? that's how I felt editing the names)
(I intend to publish a map, poster size, maybe larger, that lays out how Table Calcs interact with the viz structure, but that's not the point of this post)
I'm very happy to have had the opportunity to take Tableau's certification exam for Tableau Server 8, and even happier to have passed it.
It's now my privilege to be able to use the Tableau Server 8 Certified logo, so here it is:
The exam is a good one. It's tough, long, comprehensive, and really exercises one's technical knowledge and ability to think about how Tableau Server works. It's long, at six hours, which is enough to cause a fair bit of anticipatory stress, and it's worth taking the full time allotment.
I want to extend my thanks to everyone I had the pleasure of working with in achieving this: Rebecca Nelson, John Cicero, Sarah Pierre-Louis, and Courtney Jacobsen. I was made welcome and comfortable, and really enjoyed meeting all of you.
This post simply compiles the high(ish) topics in the Tableau Server performance online help into a single place. This makes it easier to get a coherent overview of the range of considerations involved that by paging back and forth through a bunch of web pages. Or in the downloadable Server admin PDF.
The top level topics are links to their original source help pages, as are some of the subtopics.
Use performance workbooks to analyze and troubleshoot performance issues pertaining to different events that are known to affect performance, including:
Do you find puzzling out Tableau Server permissions confusing and mysterious? You're not alone.
I put this post together to help me figure out the process of how Tableau Server determines a User's permissions for a particular Workbook, Dashboard, or Worksheet. To my mind, the Tableau documentation is a bit twisty and hard to trace. It also doesn't surface the critical part that it's not always the view's permissions that are used, but those of the view's Workbook.
It's a work in progress. I plan on improving it as I work through the factors, interactions, dependencies, etc.
users cannot connect per the TS doc
? should it therefore be impossible to assign permissions to an unlicensed user?
Viewers
cannot be assigned permissions other than 'View', 'Add Comments', and 'View comments'
Interactors
can be assigned any permissions
Guests
'users without an account on the server see and interact with an embedded view. When enabled, the user can load a webpage containing an embedded visualization without logging in. This option is only available with a core-based server.'
from the TS Admin Guide | About Enable Guest & Enable Automatic Login: "Enable Guest is a setting on the Maintenance page that can be selected if you have a core-based server license... users click a link and they go directly to the view with no login... no authentication is performed. The Tableau Server Guest User account is used to access the server, but as long as Enable Guest is selected, anyone can use it. Administrators often limit the capabilities of the Guest User account. For example, they might edit the permissions of certain views so that Guest User is denied access.
There are two distinct but inter-related 'things' Tableau lumps together as User Rights.
Publish if designated as a Publisher, the user can: "connect to Tableau Server from Tableau Desktop in order to publish and download workbooks and data sources."
There are two configuration options for Publish:
Allow
provides the User the ability noted above, although the online doc doesn't explicitly enumerate this.
NOTE: as of TSv8.1b7 it's possible to assign "Allow" for an unlicensed Site user.
AND: this unlicensed user with Publish rights CAN successfully publish to Tableau Server.
Deny
similarly, although not explicitly in the doc, presumably when Publish is denied the User cannot publish or download Workbooks and Data Sources.
? If Publish is set to 'Deny', can the User be assigned any of the download permissions on individual objects, and if so, what would be the result?
Admin Prerequisites in order for a user to be an admin s/he must be an Interactor with Publish granted.
Site Admin
"Can manage groups, projects, workbooks, and data connections. By default, site administrators can also add users and assign user rights and license levels but a system administrator can disable that (see Editing Sites)"
Server Admin
"all the rights of a site administrator, plus they can license unlicensed users, control whether site administrators can add users, create additional system administrators, and they can administer the server itself. This includes handling maintenance, settings, schedules, and the search index"
None
the user is not an admin.
There is an interesting asymmetry in the mechanisms of assigning User Rights. In my testing with Tableau Server v8.1 beta 7, when adding a new User I try to make it an Interactor and the Interactor license level isn't granted because the # of licensed users has been reached:
when checking the "Publish" User Right right, and that user subsequently becomes licensed as an Interactor the Publishing right is preserved;
however, when checking "Site Administrator", subsequently licensing the user as an Interactor doesn't preserve the "Site Adminstrator" in the same manner as was "Publish".
Things get really conplicated with the introduction of User Identity. There are three distinct facets to a User's identity vis-a-vis Permissions:
The Individual
The User, identified by their User id. Permissions are always resolved to the User; how they get resolved is the question.
Roles
are bundles of permissions that can be associated with Users and Groups for specific Tableau Server assets (which begs the question: what's a Tableau Server asset?)
Groups
Users can have membership in zero, one, or more Groups. Asset Permissions may be individually associated to Groups, or Roles may associate bundles of Permissions.
One of the big complicating factors in determining whether a given permission is granted or denied to a particular User for a particular Tableau Server asset is the different relationships between the structural and permission-resolution relationships between Users, Roles, and Groups.
Users may belong to one or more Groups at the Site level.
Users and Groups may be associated with zero or one Role for a particular asset.
When Tableau Server determines individual Permissions' status for a user for a particular asset it assesses, in order, the Permissions' status for:
— the User;
— any Role the User is associated with for that asset;
— the permission status for that asset for any Groups to which the User belongs.
How Permissions Are Set– The Tableau Server Admin Guide Flowchart redrawn for consistent Yes/No sequence and highlighting of Roles and Groups influence.
The permissions chart above is in SVG and was created using Inkscape.
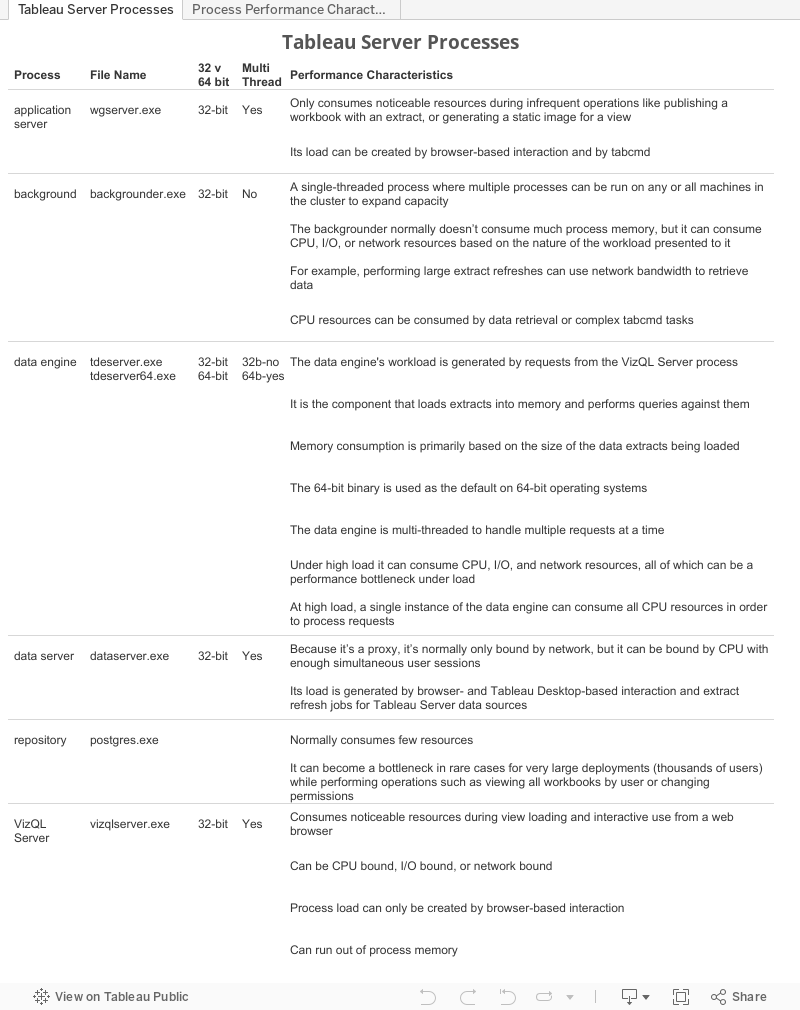
Here's a Tableau Public workbook with a couple of dashboards presenting views of the Tableau Online help information about the Tableau Server processes.
I found that by listing the different performance characteristics and cross-referencing them to the processes I was able to get a new perspective on what the do, and in particular what their limitations and potential overload scenarios are. It's a big help to look down the list and see what might come up, and then see what process might be involved.
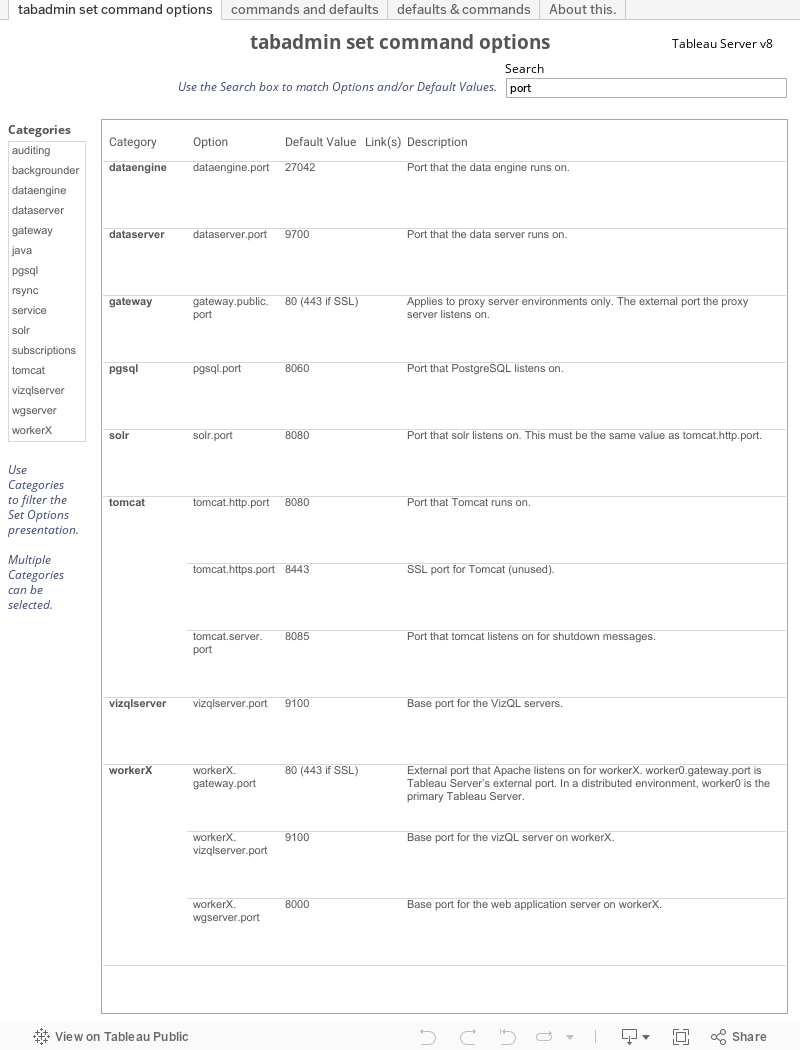
The Tableau Public workbook below contains dashboards I put together to help me organize and interpret the various options available for the Tableau Server tabadmin set command.
Although the set command information is available in Tableau's online help here it's in a static HTML table, and I find it a lot more useful to have it in data so I can use Tableau to organize, filter, and reshuffle it in various ways when building my mental map of how the options relate to one another.
You can use the dashboards from Tableau public or download the workbook. Or if you're interested in how I got the online help content into data I've put that information below.
Rendering the online help table as data. Since the HTML table is no-frills you can simply copy and paste it into Tableau. This works perfectly well since there are no HTML tags inside the table's cells to confuse Tableau. But its wasn't quite what I was after.
There are links in the options' descriptions that the copy/paste into Tableau method doesn't capture. I thought it helpful to have these so I whipped up a little Ruby script to parse the HTML and extract everything into a CSV file. And since the Jet engine hasn't yet been replaced (but soon, soon) I split the descriptions into 250-character sections, and recombined them with a calculated field after extracting the data into a TDE.
Using the Ruby script has several dependencies:
it's a Ruby script so your machine must be able to run Ruby, and you must have permissions to do so (sometimes not so easy in a corporate environment);
it uses some non-standard Ruby gems (libraries) so these need to be installed on your system – this is usually very straightforward and a quick Google will show the way;
you really should be comfortable with this level of technical stuff – if you're not there's likely someone nearby who can help, or you can always contact me.
# TTC_TabadminHelpToDataTv8.rb - this Ruby script Copyright 2013, Christopher Gerrard

require 'nokogiri'
require 'open-uri'

$recNum = 0
$Tv8HelpRoot = 'http://onlinehelp.tableausoftware.com/v8.0/server/en-us/'


$CSVOptionsHeader = 'Category,Option,Default Value,Description1,Description2,Link1,Link1Label,Link2,Link2Label'
$CSVOptionsFormat = "\"%s\",\"%s\",\"%s\",\"%s\",\"%s\",\"%s\",\"%s\",\"%s\",\"%s\""

def init
    $fOpts = File.open("TTC_tabadminSetOptionsTv8.csv", 'w')
    $fOpts.puts $CSVOptionsHeader  unless $fOpts.nil?
end

def cleanTxt txt
   return txt.gsub(/\\n/,' ').gsub(/"/,'""').strip
end

def pullCmds helpFile
  doc = Nokogiri::XML(open(helpFile))
  cmdTable = doc.xpath('.//contents/body/div/table/tbody')
  cmdTable.each do |t|
     cmdRows = t.xpath('.//tr')
     cmdRows.each do |r|
        tds = r.xpath('.//td')
        option  = tds[0].text.gsub(/\\n/,' ').strip
        category = option.split('.')[0]
        default = tds[1].text.gsub(/\\n/,' ').strip
        desc    = tds[2].text.gsub(/\\n/,' ').strip
        desc1   = desc[0..250]
        desc2   = desc[251..501]
        links = tds[2].xpath('.//a')
           link1 = if links[0].nil? then '' else $Tv8HelpRoot + links[0].xpath('./@href').text.gsub(/\\n/,' ').strip end
           link2 = if links[1].nil? then '' else $Tv8HelpRoot + links[1].xpath('./@href').text.gsub(/\\n/,' ').strip end
           l1l   = if links[0].nil? then '' else links[0].text end
           l2l   = if links[1].nil? then '' else links[1].text end
           $fOpts.puts $CSVOptionsFormat % [category,option, default, desc1, desc2, link1, l1l, link2, l2l]
     end
  end
end

init

pullCmds 'tabadmin set options cleaned.xml'
#NOTE: the Tableau online help page has been saved locally as an XML file and cleaned up a bit

$fOpts.close unless $fOpts.nil?
What TTC_TabadminHelpToDataTv8.rb does.
It accesses each row in the table as a separate set command option.
The first column contains the option's name.
The second column contains the option's default value.
The third column contains the option's description, which may exceed 255 charcters and contains zero, one, or two links, so the description is processed thus:
the description is split into two parts, each stored as its own field;
the links, if any, are captured as both a URL and label;
The fields are written into the CSV file.
How to use TTC_TabadminHelpToDataTv8.rb
Prerequisites
Minimal technical skills.
Have Ruby installed and ready to run.
Have the Nokogiri Ruby gem installed—it's used in the XML parsing.
Have the open-uri Ruby gem installed.
Have TTC_TabadminHelpToDataTv8.rb in place—it doesn't matter where, or what name you use, as long as you know where it is.
You can copy the code above and paste it into your favourite text editor.
Running TTC_TabadminHelpToDataTv8.rb
Open a command prompt. (you can run it otherwise, but this is simple and straightforward)
CD to the directory containing the XML file you captured the online help page into.
Run it: "[path to]\ruby [path to]\TTC_TabadminHelpToDataTv8.rb"
Presto. You now have a CSV file containing the tabadmin set command options as data.
The usual caveats.
TTC_TabadminHelpToDataTv8.rb works fine for me. But I wrote it and prepared the XML file it parses.
I hope it works for you, but make no guarantees.
If you do use it and make improvements I hope that you'll post them back here as comments so I can learn from them, and hopefully other people can benefit from them too.