This is a really odd one.
I was working on my map of the Quick Filter creation pathways and something wasn't quite right.
It took a bit to puzzle out what was off: under some conditions if you have Tableau show a Quick Filter for a field it'll show you one, but if you then extract the data source into a TDE and then ask Tableau to show a Quick Filter—for the same field, it will show you a different filter type.
To illustrate.
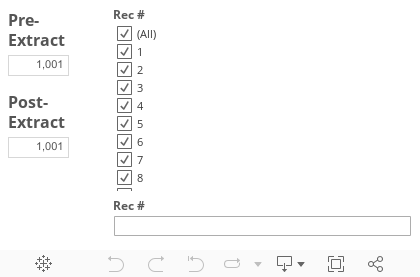
This data is about as simple as can be. There's only one field in the CSV file RecNum.csv, named "Rec #". There are 1,001 records in the file, numbered sequentially from 1 to 1,001
I routinely create a "Rec #" field in data that I'm exploring, it makes it easy to track down individual records.
Open RecNum.csv from within Tableau.
Start with some data.
        Rec #
        1
        2
        3
        4
        5
        6
        7
        8
        9
        10
        11
        ... {989 records}
        1001
Create a Quick Filter for "Rec #".
This image shows a worksheet built after RecNum.csv was opened. Things to note:
- "Rec #" was moved from Measures to Dimensions since it's intended for use as a record identified.
- "Number of Records" was placed into the data area since Tableau likes to have some data in play before creating Quick Filters.
The value for SUM(Number of Records) is 1,001 – the number of records in RecNum.csv
- Right-clicking "Rec #" and selecting "Show Quick Filter" causes Tableau to create and show a Multiple Values (List) Quick Filter for "Rec #".
So far, so good. All is well.
Extract RecNum.csv into a TDE.
(not shown – I hope this step doesn't need exposition)
Now for the interesting bits.
Create a new worksheet and another Quick Filter for "Rec #", the same way as above.
Note that Tableau now creates and shows a Multiple Values (Custom List) Quick Filter for "Rec #".
This is decidedly odd, and can be more than a little perplexing.
Both Quick Filters.
This dashboard contains both the pre- and post-extract worksheets, with their Quick Filters.
The Packaged Workbook.
Here's the packaged workbook published to Tableau Public.
But wait! There's more!
Tableau doesn't always create the Multiple Values (Custom List) Quick Filter for "Rec #".
If RecNum.csv contains 1,000 records instead of 1,001 records Tableau will create a good old ordinary Multiple Values (List) Quick Filter for "Rec #".
Let me say that again:
- with 1,000 records, extracting the data does not change the type of Quick Filter Tableau creates for "Rec #", but
- with 1,001 records, extracting the data does change the type of Quick Filter Tableau creates for "Rec #"
What's happening here?
Why does Tableau create one type of Quick Filter for native data and another for extracted data?
Could it be because in the process of extracting the data Tableau learns something about it that leads it to believe that the native default Quick Filter is not a good choice, so it substitutes for it?
The Dimension Domain Effect.
It appears likely that's what's going on. If, after opening RecNum.csv and moving "Rec #" to Dimensions you load the domain for "Rec #"—right-click | Describe | Load—Tableau will produce the Multiple Values (Custom List) Quick Filter for the un-extracted "Rec #".
This may make sense technically, but it's really an unfortunate situation from the human factors standpoint.
The Dimension Domain Quick Filter Threshold.
When I opened a version of the CSV with only 1,000 records, make "Rec #" a Dimension, load its Domain, and then have Tableau produce the Quick Filter it once again shows the Multiple Measures (List) Quick Filter type. So, at least with this data, 1,000 discrete members is the threshold that Tableau uses to decide which type of Quick Filter to produce:
# of
Dimension Members | | Tableau produces Quick Filter type |
|---|
| <= | 1,000 | | Multiple Values | (List) |
| >= | 1,001 | | Multiple Values | (Custom List) |